Live
Regression
Entering your data
To enter your own data, you must
- Prepare the data set
- Put it on the web
using Dropbox
- Shorten the URL
using bit.ly
- Enter the shortened
URL into the widget
Once the data set has its
short bit.ly URL, then anyone can use the widget on your data
using the URL.
Preparing the data set
The data set must be a text file in CSV (comma separated values)
format. In other words, it should look like this:
GDP,Population,GeographicSize,LatitudeofCapital,LongitudeofCapital
10380.38,1372.45,9573,40,116
2049.50,1278.11,3166,29,77
17418.93,321.961,9526,40,-77
888.65,255.780,1905,-6,107
2353.03,204.998,8516,-16,-48
250.14,190.595,882,34,73
573.65,182.202,924,9,7
185.42,159.140,148,24,90
1857.46,146.605,17098,56,38
4616.34,126.832,378,36,140
1282.73,121.005,1964,19,-99
284.93,102.152,300,15,121
The first line of the
text file is the list of variable names, and each line after
that contains numerical values separated by commas. The
data above is for the largest twelve countries by population
(China, India, United States, Indonesia, Brazil, Pakistan,
Nigeria, Bangladesh, Russia, Japan, Mexico, and the Philippines). Variable
names should be alphanumeric (no special characters), and
there should be no missing data entries.
Excel and most statistical software can export your data
as a CSV file.
Put
your data set on the web
The easiest way to put your data set file on the web
is to use Dropbox. If you use Dropbox, make sure
your file is in your Dropbox folder. Then log into
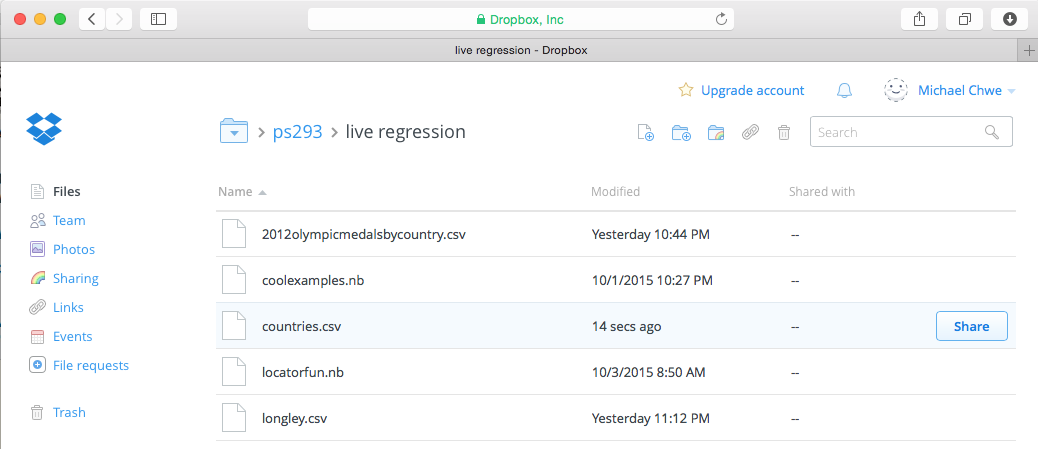
dropbox.com, find your
file in the file picker, in this case countries.csv,
and then click the "Share" button which appears on the
right.
Dropbox will respond by giving you the following dialog box which
includes a URL which is your "Link to file".
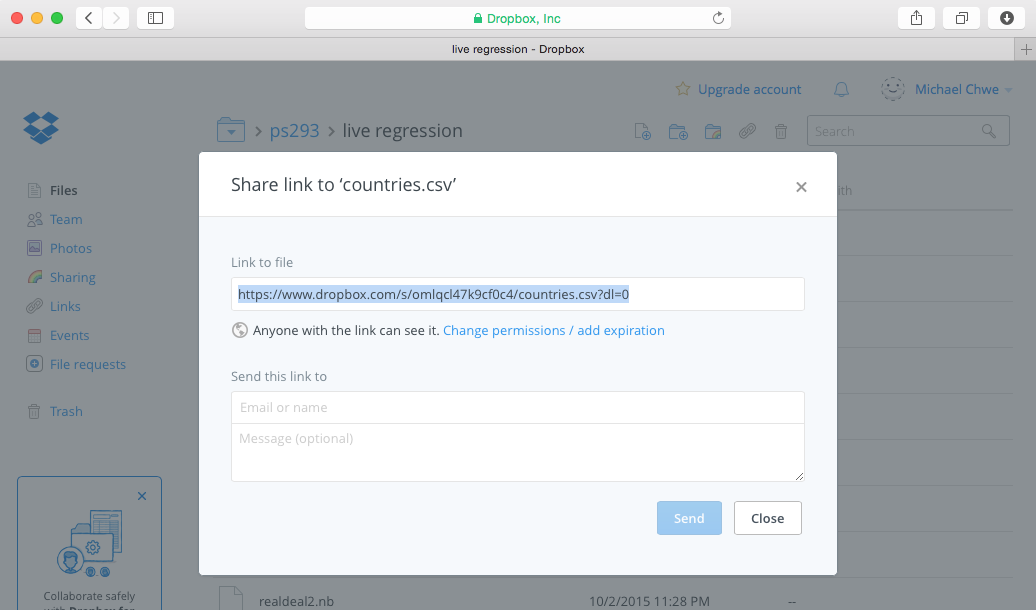
Take this URL
https://www.dropbox.com/s/omlqcl47k9cf0c4/countries.csv?dl=0
and now all you have to do is to delete the dl=0 part at the end and replace
it with raw=1 like this:
https://www.dropbox.com/s/omlqcl47k9cf0c4/countries.csv?raw=1
Shorten the URL
Since this URL is too long to put into the widget (the widget is
written in Mathematica, which disallows text inputs in widgets),
next you shorten it using bit.ly.
Go to bit.ly and then paste the URL
into the box at the top of the page, and then you will receive a
shortened link such as this:
http://bit.ly/1OgRUN1
Once you have created this URL, it is "permanent" and you don't
have to go through all the steps above just to use the widget
again. If you revise the data file on your local computer,
the widget will import the revised data when you click the "Import
Data" button in the widget. If you move the file to a
different location on your computer, however, the link will no
longer work and you will have to create a new one.
Using the widget
Now
you can enter this short link into the widget and
press the "Import Data" button at the top left.
If you just want to try out the widget without importing your
own data, just click on the "Example data sets" button and you
can choose among some examples
there.
Choose the dependent variable from the dropdown menu. In
the example below, the dependent variable chosen is GDP.
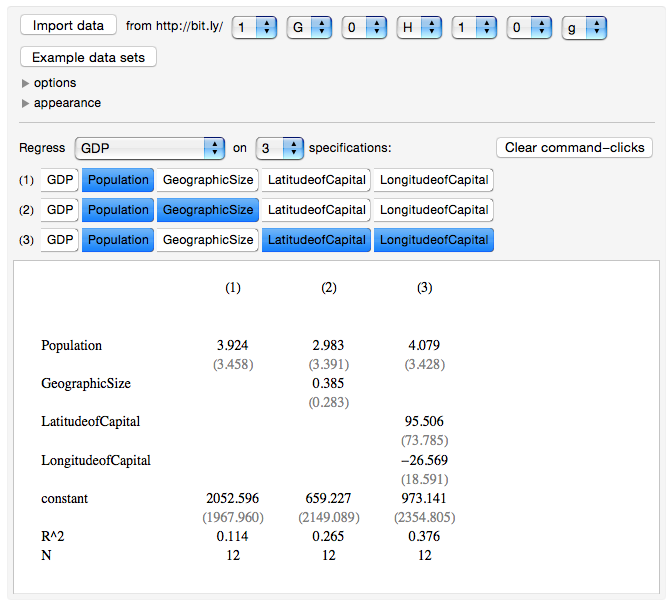
Here GDP is regressed on three specifications. In the
first, GDP is regressed on Population. In the second,
GDP is regressed on Population and GeographicSize. In
the third, GDP is regressed on LatitudeofCapital and
LongitudeofCapital. A constant term is included in all
of these regressions (right now there is no way to turn off
the option of including a constant term). To change the
number of specifications (up to a maximum of 10), use the
drop-down menu.
To include or not include an independent variable in a
specification, simply click on the variable name in the row of
buttons. If the set of independent variables is empty or
includes the dependent variable, an error results and no
regression results are shown.
Another way to include an independent variable in a
specification is to command-click (or alt-click, if you are
using a Windows computer) inside the output window. In the
example below, the command-clicks (the blue squares) cause
LatitudeofCapital and LongitudeofCapital to be included in the
first specification.
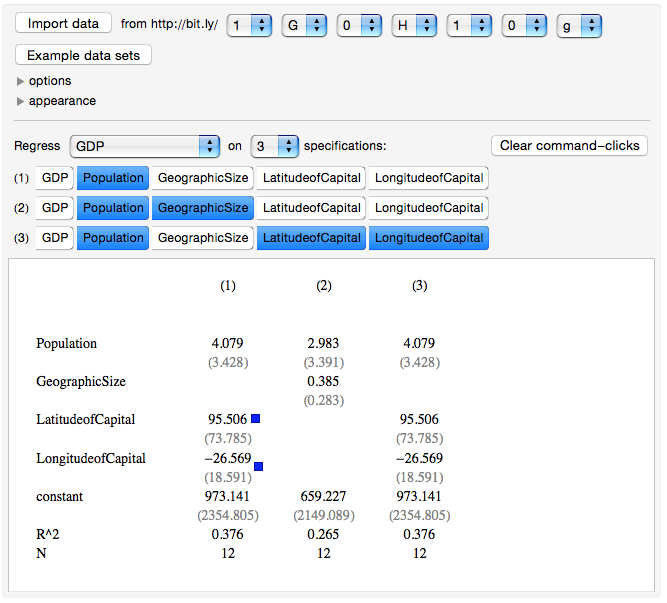
To clear the command-clicks, press the button "Clear
command-clicks."
If you click the arrow in front of "options," various options
will appear.
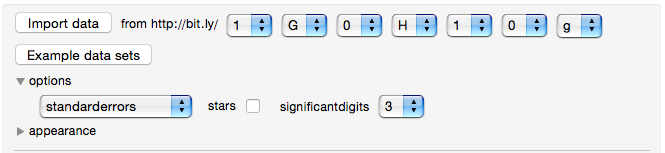
The first pop-up menu allows you to display either standard
errors, t statistics, p values, or 95% confidence intervals of
the estimated coefficients (or nothing at all). These
are displayed in parentheses and in gray underneath each
estimated coefficient.
If you check the stars checkbox, then stars will appear next
to the coefficients. Three stars indicates the
coefficient is significant with probability 0.999 or
greater. Two stars indicate it is significant with
probability 0.99 or greater. One star indicates that it
is significant with probability 0.95 or greater.
You can also choose how many significant digits are shown for
the fractional parts of numbers.
If you click the arrow in front of "appearance," you can
adjust the appearance of the output.
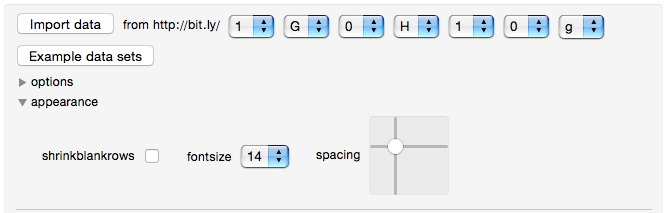
If you check the "shrinkblankrows" box, then rows of white
space are deleted; this is useful if there are many possible
dependent variables but your specifications only include a few
of them. You can choose the font size (in points) of the
output font (Times). Finally, you can use the spacing
slider to change the horizontal spacing between specifications
and the vertical spacing between rows.
Please explore all of these controls. Please send any
comments or suggestions to michael@chwe.net.